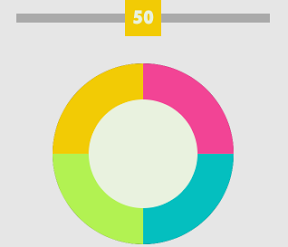

円グラフを表示するiPhoneアプリを作ってみます。赤、青、緑、黄の4つ項目の割合をスライダーで操作できるようにして、その割合を円グラフで画面に表示する感じで書いていきます。
動作イメージ
XcodeからiOS6 iPhone Simulatorで動かすとこんな感じになります。
ポイント
各項目のスライダー部分は、UIViewでバーを作って、その中にUILabelでPanGestureを設定したマーカーを入れています。PanGestureのイベントの中で、スライダーのラベルに表示した数値の変更と、円グラフの更新をしています。
サンプルコード
#import “ViewController.h”
#import <QuartzCore/QuartzCore.h>
#define UIColorHex(rgbValue) [UIColor colorWithRed:((float)((rgbValue & 0xFF0000) >> 16))/255.0 green:((float)((rgbValue & 0xFF00) >> 8))/255.0 blue:((float)(rgbValue & 0xFF))/255.0 alpha:1.0]
@interface ViewController () {
NSMutableArray *markers;
UIView *chart;
}
@end
@implementation ViewController
– (void)viewDidLoad
{
[super viewDidLoad];
self.view.backgroundColor = [UIColor colorWithWhite:0.9 alpha:1];
[self createSliders];
[self createPieChart];
}
– (void)createSliders
{
markers = [[NSMutableArray alloc] init];
for (int i=0; i<4; i++) {
UIView *slider = [self createSlider:[self color:i]];
slider.center = CGPointMake(160, 50 * (i + 1));
slider.tag = i;
}
}
– (UIView*)createSlider:(UIColor*)color
{
UIView *slider = [[UIView alloc] initWithFrame:CGRectMake(0, 0, 280, 40)];
slider.backgroundColor = [UIColor clearColor];
[self.view addSubview:slider];
UIView *bar = [[UIView alloc] initWithFrame:CGRectMake(0, 15, 280, 10)];
bar.backgroundColor = [UIColor lightGrayColor];
[slider addSubview:bar];
UILabel *marker = [[UILabel alloc] initWithFrame:CGRectMake(120, 0, 40, 40)];
marker.backgroundColor = color;
marker.text = @”50″;
marker.font = [UIFont fontWithName:@”Futura-CondensedExtraBold” size:20];
marker.textAlignment = 1;
marker.textColor = [self color:4];
[slider addSubview:marker];
marker.userInteractionEnabled = YES;
UIPanGestureRecognizer *pan = [[UIPanGestureRecognizer alloc] initWithTarget:self action:@selector(slide:)];
[marker addGestureRecognizer:pan];
[markers addObject:marker];
return slider;
}
– (void)createPieChart
{
chart = [[UIView alloc] initWithFrame:CGRectMake(60, 250, 200, 200)];
chart.backgroundColor = [UIColor blackColor];
chart.layer.cornerRadius = 100;
[self.view addSubview:chart];
float red = [[[markers objectAtIndex:0] text] intValue];
float blue = [[[markers objectAtIndex:1] text] intValue];
float green = [[[markers objectAtIndex:2] text] intValue];
float orange = [[[markers objectAtIndex:3] text] intValue];
float total = red + blue + green + orange;
if (total != 0) {
red = red / total * 2 * M_PI;
blue = blue / total * 2 * M_PI;
green = green / total * 2 * M_PI;
orange = orange / total * 2 * M_PI;
} else {
red = M_PI / 2.0;
blue = M_PI / 2.0;
green = M_PI / 2.0;
orange = M_PI / 2.0;
}
float ratios[] = {red, blue, green, orange};
float start = 0;
for (int i=0; i<4; i++) {
UIBezierPath *path = [UIBezierPath bezierPath];
float end = start + ratios[i];
[path moveToPoint:CGPointMake(100, 100)];
[path addArcWithCenter:CGPointMake(100, 100) radius:100 startAngle:start – M_PI/2.0 endAngle:end – M_PI/2.0 clockwise:YES];
CAShapeLayer *sl = [[CAShapeLayer alloc] init];
sl.fillColor = [self color:i].CGColor;
sl.path = path.CGPath;
[chart.layer addSublayer:sl];
start = end;
}
UIView *mask = [[UIView alloc] initWithFrame:CGRectMake(0, 0, 120, 120)];
mask.layer.cornerRadius = 60;
mask.center = CGPointMake(100, 100);
mask.backgroundColor = [self color:4];
[chart addSubview:mask];
}
– (void)slide:(UIPanGestureRecognizer*)gr
{
CGPoint p = [gr locationInView:gr.view.superview];
UILabel *marker = (UILabel*)gr.view;
if (p.x < 20) {
p.x = 20;
} else if (p.x > 260) {
p.x = 260;
}
marker.center = CGPointMake(p.x, marker.center.y);
int number = 100 * (p.x – 20) / 240;
marker.text = [NSString stringWithFormat:@”%d”, number];
[chart removeFromSuperview];
[self createPieChart];
}
– (UIColor*)color:(int)i
{
switch (i) {
case 0:
return UIColorHex(0xF24495);
case 1:
return UIColorHex(0x04BFBF);
case 2:
return UIColorHex(0xB2F252);
case 3:
return UIColorHex(0xF2CB05);
case 4:
return UIColorHex(0xE9F2DF);
default:
break;
}
return nil;
}
– (void)didReceiveMemoryWarning
{
[super didReceiveMemoryWarning];
// Dispose of any resources that can be recreated.
}
@end